Loading…
Loading…
System monitor for the menu bar

Stats — Official Website
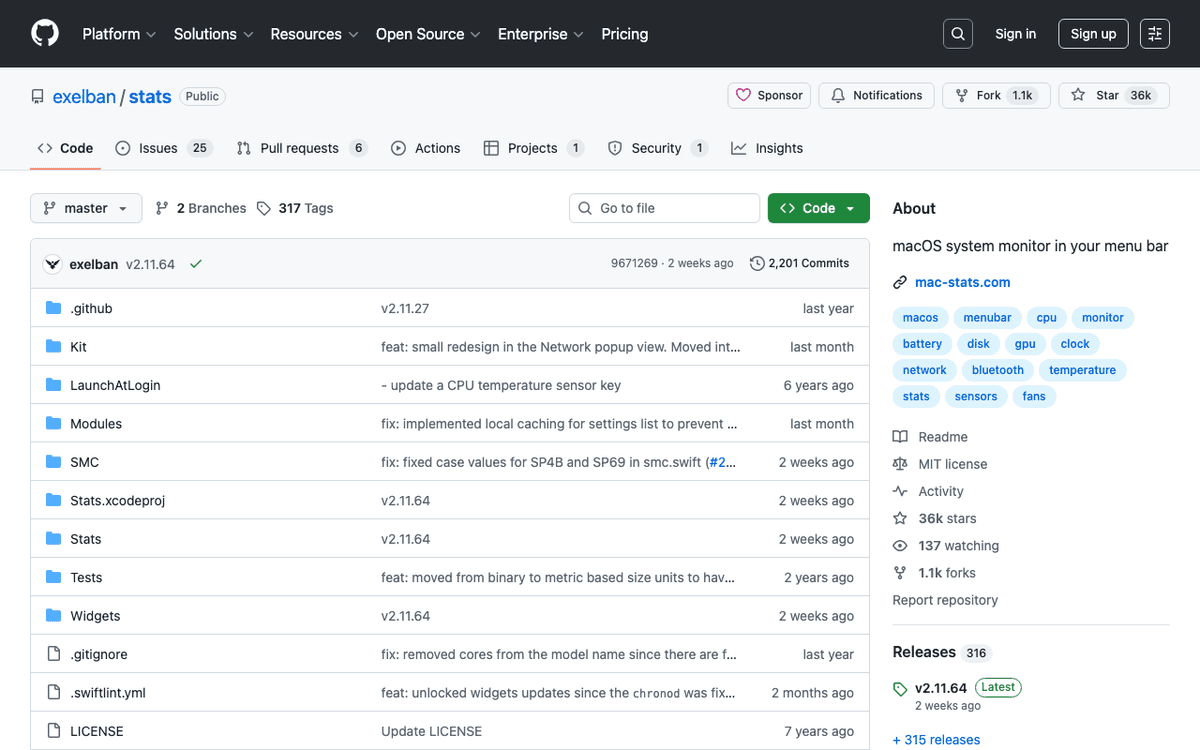
brew install --cask statsStats is a free, open-source macOS system monitoring application designed to provide real-time insights into your Mac's performance directly from the menu bar. Developed by the community, it offers a lightweight yet comprehensive suite of modules to track crucial system metrics including CPU utilization, RAM usage, disk activity, network traffic, battery health, and sensor readings. It caters to a wide audience, from power users and developers who demand constant oversight of their system's vitals to casual users who simply want to keep an eye on battery life or ensure their Mac is running smoothly. In 2026, with the widespread adoption of Apple Silicon Macs and the continuous evolution of macOS, Stats remains highly relevant. Its native compatibility with Apple Silicon ensures optimal performance and efficiency, integrating seamlessly into the modern macOS ecosystem. The app's commitment to being open-source means it benefits from community contributions, ensuring it stays updated with the latest macOS features and hardware advancements, unlike some proprietary alternatives that might lag. Its significance lies in offering transparency and control; users can quickly diagnose performance bottlenecks, monitor resource-intensive applications, or simply satisfy their curiosity about their machine's inner workings without bogging down their system. Key differentiators include its zero-cost barrier to entry, extreme customizability, and its lean resource footprint, making it an indispensable tool for anyone seeking a non-intrusive yet powerful system overview.
Stats is a free, open-source macOS system monitor that provides a comprehensive overview of your Mac's performance directly in the menu bar. It tracks crucial metrics like CPU, GPU, memory, disk, network usage, and battery health, offering a user-friendly and customizable alternative to built-in tools.
Stats emerged as a free and open-source solution for macOS users seeking detailed system monitoring in their menu bar, akin to commercial alternatives like iStat Menus. Developed by Serhiy Mytrovtsiy, it gained traction for its robust features and customizable interface, catering to users who desire immediate insights into their Mac's health. Since its initial release, Stats has undergone continuous development, with regular updates ensuring compatibility with the latest macOS versions and Apple Silicon. Its commitment to being a free and open-source project, coupled with a focus on user experience, has solidified its position as a go-to utility for Mac power users.
Stats is built specifically for macOS, leveraging the operating system's capabilities to gather and display system metrics efficiently. It's designed to be lightweight and minimize energy impact, though certain modules like Sensors and Bluetooth can be more resource-intensive. The application resides in the menu bar, providing at-a-glance information for various components like CPU, GPU, memory, disk, network, and battery. Stats is compatible with macOS 10.15 (Catalina) or later and supports both Intel 64 and Apple Silicon architectures. It utilizes external APIs for functions like update checks and retrieving public IP addresses, with a commitment to using its own server for IP retrieval to avoid third-party reliance.
Stats cultivates a robust ecosystem centered around its modular design and open-source nature. While it doesn't have a formal 'plugin store,' its modular structure inherently allows for the addition and customization of various monitoring components, or 'modules.' The open-source aspect on platforms like GitHub encourages community contributions, where users can propose fixes, improvements, and even new features. This collaborative environment extends to how new Apple Silicon sensor keys are integrated, relying on community knowledge to accurately match sensor data. Although fan control is a legacy feature, the developer remains open to community pull requests for its enhancement. The application's flexibility also extends to customizable widgets, allowing users to tailor the displayed information to their specific needs.
Recent updates for Stats in 2025 and early 2026 have focused on stability, compatibility, and refinement of existing features. Updates in early 2026 show continued maintenance and minor version bumps. While Apple's own Mac roadmap in 2025-2026 is focused on M5 and M6 chip integration and potential new Mac Pro and Studio models, Stats's development typically aligns with supporting the latest macOS versions and hardware. The project's future direction will likely continue to prioritize efficient system monitoring, adapting to new Apple hardware and software changes, and incorporating community-driven improvements for enhanced user experience. Ongoing efforts include addressing sensor accuracy for new Apple SoCs and optimizing energy consumption for all modules.
The CPU module in Stats provides a detailed breakdown of your Mac's processor activity. Users can observe real-time CPU load, broken down by user, system, and idle percentages. It also displays core frequencies and temperatures (where available), allowing for immediate identification of processes that are heavily utilizing the CPU. This is crucial for power users and developers who need to optimize application performance or troubleshoot overheating issues. The module supports both Intel and Apple Silicon architectures, accurately reporting performance and efficiency core usage, giving a granular view of how your Mac's brain is working at any given moment. Customization options allow users to choose between various graph styles and display information like average load or peak usage.
Stats offers an intuitive visual representation of your Mac's memory (RAM) utilization. Users can quickly see how much memory is free, used, cached, and compressed. This module helps identify memory leaks or applications consuming excessive RAM, which can significantly impact system responsiveness. For professionals dealing with memory-intensive tasks like video editing, 3D rendering, or large data analysis, this insight is invaluable for resource management. The display can be customized to show different metrics, such as a percentage bar, raw gigabyte values, or a combination, making it easy to gauge memory pressure and decide if closing certain applications is necessary for optimal performance.
Keeping an eye on your storage drives is essential for maintaining system health and performance. The disk module in Stats monitors read and write speeds for all mounted volumes, including internal SSDs and external drives. This helps in understanding data transfer rates, identifying potential storage bottlenecks, or confirming if a backup process is actively running. For users working with large files or frequent data transfers, observing disk activity can pinpoint delays. The module provides real-time graphs and numerical values, ensuring you're always aware of how your storage is performing without needing to delve into complex system logs. It supports APFS and other common macOS file systems.
The network module provides a clear, concise view of your Mac's internet and local network activity. It displays real-time upload and download speeds, total data transferred since boot, and the current IP address. This is incredibly useful for diagnosing network connectivity issues, monitoring data usage (especially for capped internet plans), or simply seeing if an application is actively transferring data in the background. Users can choose to monitor specific network interfaces, allowing for focused insights into Wi-Fi, Ethernet, or even VPN connections. Visual graphs make it easy to spot spikes in network traffic, helping users understand if their connection is performing as expected.
For laptop users, battery life and health are paramount. Stats' battery module offers comprehensive insights into your MacBook's power source. It displays the current charge level, estimated time remaining (for both charging and discharging), cycle count, and the battery's current health status. This allows users to track the long-term degradation of their battery and make informed decisions about battery replacement or usage habits. Additionally, it can show the current power consumption in watts, giving a deeper understanding of how much energy your Mac is drawing. This module is essential for maximizing battery lifespan and managing power consumption effectively throughout the day.
Beyond the core components, Stats can also tap into various hardware sensors on your Mac. This includes monitoring CPU, GPU, and SSD temperatures, as well as displaying fan speeds. For users who push their machines to the limit, these readings are critical for preventing overheating and ensuring system stability. While primarily a monitor, some configurations or community forks might offer basic fan control (though the core Stats app focuses on monitoring). Knowing the exact temperatures helps users understand if their cooling system is adequate or if their Mac is thermal throttling, providing invaluable data for performance optimization and hardware longevity.
A software developer is compiling a large project and needs to ensure their Mac's CPU and RAM are performing optimally. They use Stats to monitor core utilization and memory pressure in real-time, immediately identifying if their build process is bottlenecked by resources or if background tasks are consuming too many cycles. Quick glances at the menu bar help them decide if they need to close other applications or adjust their workflow for maximum efficiency.
A user is playing a demanding game or rendering a complex video project. They rely on Stats to keep an eye on GPU and CPU temperatures, ensuring their system isn't overheating and causing performance drops. They also monitor network activity to check for latency spikes during online gaming or to confirm large files are uploading/downloading efficiently, preventing any unexpected interruptions to their immersive or creative workflow.
Someone working remotely from a coffee shop needs to maximize their MacBook's battery life. They frequently check Stats' battery module to monitor their current charge, estimated time remaining, and power consumption. By observing which applications might be drawing excessive power, they can adjust their usage patterns or close resource-hungry apps to extend their uptime significantly, ensuring they don't run out of juice mid-task.
A Mac user notices their system is unusually slow or unresponsive. They open Stats to quickly scan CPU, RAM, and disk activity. A sudden spike in disk writes might indicate a runaway process, or consistently high RAM usage could point to a memory leak in a recently installed application. Stats provides the initial clues needed to narrow down the problem, saving time and effort in diagnosing system performance issues without opening Activity Monitor.
Installing Stats on your macOS device is a straightforward process, offering both a convenient command-line method via Homebrew and a traditional manual installation for those who prefer it. Follow these steps to get Stats up and running, providing you with instant system insights.
Open Terminal (Applications > Utilities > Terminal) and paste the following command, then press Enter: `/bin/bash -c "$(curl -fsSL https://raw.githubusercontent.com/Homebrew/install/HEAD/install.sh)"`. Follow the on-screen prompts to complete the Homebrew installation. Homebrew is a popular package manager for macOS that simplifies installing command-line tools and graphical applications like Stats. This step is only necessary if you don't already have Homebrew set up on your system.
Once Homebrew is installed, return to Terminal and execute the command: `brew install --cask stats`. This command will download and install the latest stable version of Stats to your Applications folder. Homebrew Cask handles the specifics of installing macOS applications, making it a very efficient and clean method. Wait for the installation process to complete, which typically takes only a minute or two depending on your internet connection.
After installation, locate 'Stats' in your Applications folder and launch it. Upon the first launch, Stats will likely prompt you to grant certain permissions, such as accessibility access or full disk access, necessary for it to monitor system metrics like CPU, disk I/O, and network activity. Follow the on-screen instructions to navigate to System Settings (or System Preferences on older macOS versions) and enable these permissions. This is a standard security measure for macOS applications accessing system-level data.
Once launched and permissions are granted, Stats will appear in your menu bar. Click on the Stats icon to reveal its dropdown menu. From here, you can enable or disable individual monitoring modules (CPU, RAM, Disk, Network, Battery, Sensors). Drag and drop modules within the Stats preferences to reorder them in the menu bar according to your preference. This allows you to customize exactly what information is visible at a glance, tailoring the display to your specific needs.
Stats allows you to completely customize the order and visibility of its modules in your menu bar. Access the Stats preferences by clicking its icon in the menu bar and selecting 'Settings'. In the 'Modules' tab, you can drag and drop to rearrange the order of CPU, RAM, Disk, Network, Battery, and Sensor indicators. To reduce clutter, you can also uncheck modules you don't frequently need to hide them from the menu bar. This ensures that only the most relevant information is displayed prominently, streamlining your system overview without overwhelming your menu bar space. Experiment with different arrangements to find what works best for your workflow.
While Stats is designed to be lightweight, monitoring everything at a very high frequency can still consume some resources. Within the settings for each individual module (e.g., CPU, RAM), you'll find options to adjust the refresh rate. For less critical metrics, you might set a longer refresh interval (e.g., 2-5 seconds) to minimize its impact on your system. For crucial data like CPU load during heavy tasks, a faster refresh (e.g., 0.5-1 second) might be preferred. Balancing these settings allows you to get timely updates without unnecessarily draining battery or CPU cycles, especially on older Macs or when running on battery power.
Stats offers extensive visual customization options to match your aesthetic preferences or improve readability. For each module, you can often choose between various display styles, such as graphs, text values, or circular indicators. Furthermore, you can custom-select colors for different segments of a graph (e.g., user vs. system CPU, free vs. used RAM). This level of control allows you to create a personalized system monitor that seamlessly integrates with your macOS theme or highlights specific metrics with distinct colors for quick identification. Explore the 'Appearance' or individual module settings to tailor the visual experience.
For critical system events, Stats can be configured to provide notifications. While not as robust as some paid alternatives, you can often set basic alerts for certain thresholds. For example, you might want to be notified if your CPU temperature exceeds a certain limit, or if your battery charge drops below a specific percentage. Check the settings for relevant modules to see if notification options are available. Enabling these can help you proactively address potential issues before they become critical, such as preventing overheating during intensive tasks or reminding you to plug in your laptop before it shuts down unexpectedly.
While Stats excels as a free, open-source menu bar system monitor, several alternatives exist, each with its own strengths and target audience. Understanding how Stats compares can help you choose the best tool for your specific needs.
iStat Menus is a highly polished and feature-rich commercial system monitoring application. Compared to Stats, it offers a more extensive array of sensors, advanced historical data logging, weather information, and a significantly more refined user interface with more visual themes and customization options. However, iStat Menus comes with a recurring cost, which can be a barrier for some users. Stats, being free and open-source, provides core monitoring functionality without the financial outlay, making it a compelling choice for those prioritizing cost and basic yet robust functionality over advanced features and premium aesthetics.
Activity Monitor is macOS's built-in system utility for monitoring processes, CPU, memory, energy, disk, and network usage. It offers a detailed, tabular view of individual processes and system-wide statistics. However, its primary interface is a standalone application, not a persistent menu bar item. This means you have to actively open it to check stats, unlike Stats which provides always-visible real-time data in the menu bar. While Activity Monitor is free and comprehensive for deep dives, Stats offers a much more convenient, at-a-glance overview without requiring you to switch applications, making it ideal for continuous, passive monitoring.
MenuMeters is another classic free and open-source menu bar system monitor, similar in spirit to Stats. It provides core CPU, disk, memory, and network graphs. Historically, it was a very popular choice, but its development has been less consistent compared to Stats, especially regarding timely updates for newer macOS versions and Apple Silicon compatibility. Stats, being actively developed by a vibrant community, generally offers broader support for the latest macOS features and hardware, alongside a more modern codebase and often a wider range of customizable modules. MenuMeters is simpler but Stats provides more advanced options and consistent updates.
Stats is completely free to download and use, licensed under the MIT License. Its open-source nature means that its source code is publicly available for anyone to inspect, modify, and contribute to. There are no hidden fees, subscriptions, or in-app purchases. This makes Stats an exceptionally valuable tool for all Mac users, from individuals to organizations, providing powerful system monitoring capabilities without any financial barrier. The community-driven development ensures its continued improvement and maintenance without relying on commercial funding.
Stats thrives on its active and dedicated open-source community, primarily centered around its GitHub repository. This robust ecosystem is where users report bugs, suggest features, and contribute directly to the project's development through pull requests. The open-source model ensures that Stats remains transparent, secure, and continuously updated to keep pace with macOS advancements and hardware changes, including native support for Apple Silicon. Community members also contribute to translations, ensuring Stats is accessible to a global audience. This collaborative environment fosters rapid iteration and responsiveness to user needs, making Stats a living project that evolves with its user base rather than being dictated by a single commercial entity. The GitHub page serves as the central hub for discussions, releases, and documentation.
Marques Brownlee • 2.5M views
MacVince • 1.3M views
TechInsomnia • 26.7K views
Productivity & Workflow Analyst
Accessed Feb 15, 2026